- 03 Mar 2022
- 3 Minutos para leer
- Impresión
- OscuroLigero
- PDF
Creating a ScreenMeet Dashboard within Salesforce
- Actualizado en 03 Mar 2022
- 3 Minutos para leer
- Impresión
- OscuroLigero
- PDF
The guide below will assist you in creating reports and dashboards so that you may see data relating to your cases with and without ScreenMeet sessions.
This guide assumes that you have previous experience within the Salesforce platform and are familiar with creating reports and dashboards. These reports and dashboards can be altered/changed based on your organization's needs.
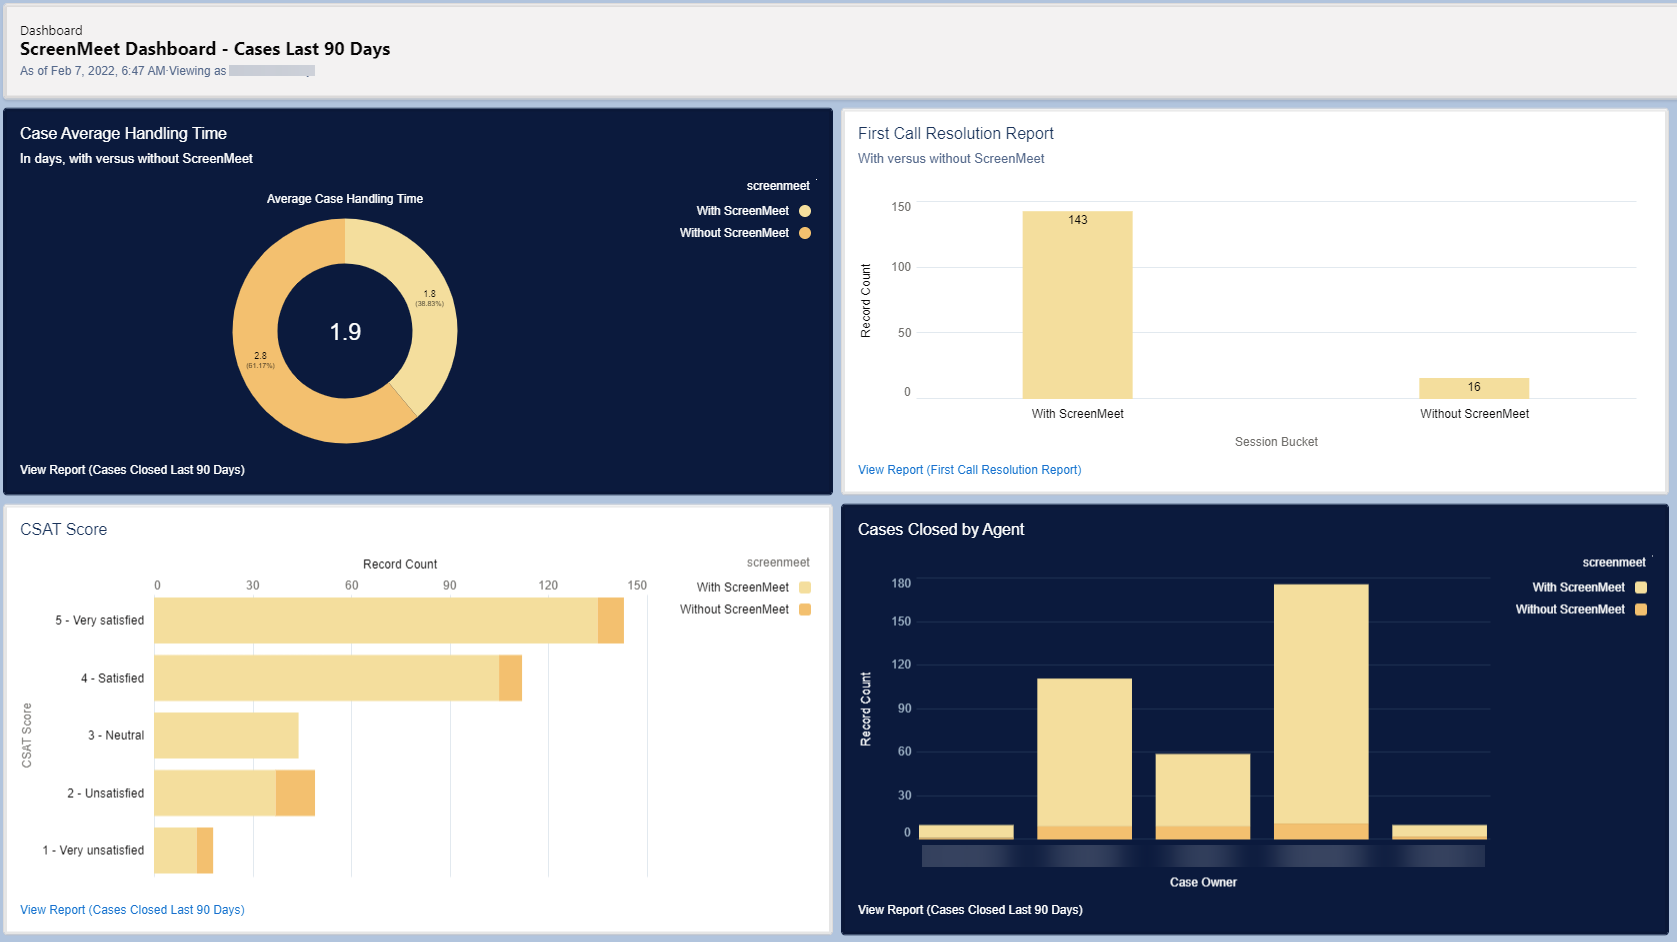
An example of what this dashboard will look like as outlined is attached below.

Prepare the Case object
2.) On the Case object, create a Checkbox field named Resolved_on_First_Contact__c
3.) On the Case object, create a Formula field named Case_Handling_Time__c
- Set the Formula Return Type to Number
- Set the Decimal Places to 2
- Set the Formula calculation to ClosedDate - CreatedDate
4.) On the Case object, create a Picklist field named CSAT_Score__c and add the following values:
- 1 - Very unsatisfied
- 2 - Unsatisfied
- 3 - Neutral
- 4 - Satisfied
- 5 - Very satisfied
5.) On the Case object, create a Rollup Summary field named ScreenMeet_Case_Sessions__c with Data Type “Roll-Up Summary (COUNT ScreenMeet Case Session)”
Creating a Custom Report Type
https://help.salesforce.com/s/articleView?id=sf.reports_defining_report_types.htm&type=5
- Select Cases as the primary object
- Set the label as Cases with or without ScreenMeet Sessions
- Store in the category most relevant for your organization
- Set the Deployment status to Deployed and click Next
- On the following screen, click (Click to relate another object)
- Select the junction object ScreenMeet Case Sessions
- Set A to B Relationship as “A” records may or may not have related “B” records
Creating the Closed in Last 90 Days report
Report: Cases Closed Last 90 Days
Report Type: Cases (standard)
1.) Create a report of report type “Cases” and add the following columns:
- Account Name
- Subject
- Date/Time Opened
- Date/Time Closed
- Case Handling Time
- ScreenMeet Case Sessions
2.) Create a bucket field “ScreenMeet Bucket” on the field “ScreenMeet Case Sessions”
- Create a Range <=0 and label it as “Without ScreenMeet”
- Create a Range >0 and label it as “With ScreenMeet”
3.) Group the columns of the report
- Group first by Resolved on First Contact
- Group second by the bucket field ScreenMeet
4.) Summarize the field Case Handling Time as Summarize - Average
5.) Summarize the field ScreenMeet Case Sessions as Summarize - Sum
6.) Add a chart to the report
- Select Display As - Bar chart
- Set the Y-Axis to Resolved on First Contact
- Add a second grouping to the Y-Axis and set it to the bucket field ScreenMeet
- Set the X-Axis to Record Count
7.) Add the following filters to the report
- Show Me: All Cases
- Date/Time Closed: Last 90 Days
- Units: Hours
- Closed equals True
8.) Save the report with the name Cases Closed Last 90 Days
Creating the Case and ScreenMeet Session Summary report
1.)Create a report of report type “Cases with or without ScreenMeet Sessions” and add the following columns:
- Account Name
- Created Date
- Closed
- Case Handling Time
- ScreenMeet Case Sessions
2.) Create a bucket field “ScreenMeet” on the field “ScreenMeet Case Sessions”
- Create a Range <=0 and label it as “Without ScreenMeet”
- Create a Range >0 and label it as “With ScreenMeet”
3.) Group the columns of the report by the bucket field ScreenMeet
4.)Summarize the field Case Handling Time as Summarize - Average
5.)Summarize the field ScreenMeet Case Sessions as Summarize - Sum
6.) Add a chart to the report
- Select Display As - Column chart
- Set the X-Axis to ScreenMeet bucket field
- Set the Y-Axis to Record Count
- Check Show Values
7.) Add the following filters to the report
- Show Me: All Cases
- Date/Time Closed: Last 90 Days
- Resolved on First Contact equals True
8.) Save the report with the name Case and ScreenMeet Session Summary
Creating the Dashboard
1.) Create a new Dashboard with the name ScreenMeet Dashboard - Cases Last 90 Days
2.) Click the Gear icon to open the Properties. Change the Dashboard Grid Size to 9 columns
3.) Add a Component with the following settings
- Select the report Cases Closed Last 90 Days
- Display As Donut Chart
- Value: Average Case Handling Time
- Sliced By: ScreenMeet
- Display Units: Shortened Number
- Show Values: checked
- Show Percentages: checked
- Combine Small Groups into "Others": checked
- Show Total: checked
- Decimal Places: Automatic
- Sort By: ScreenMeet, descending
- Legend Position: Right
- Title: Case Average Handling Time
- Subtitle: In days, with versus without ScreenMeet
4.) Add a Component with the following settings
- Report: Case and ScreenMeet Session Summary
- Use chart settings from report: checked
5.) Add a Component with the following settings
- Select the report Cases Closed Last 90 Days
- Display As: Stacked Horizontal Bar Chart
- Y- Axis: CSAT Score
- X-Axis: Record Count
- Stack By: Resolved on First Contact
- Display Units: Shortened Number
- X-Axis Range: Automatic
- Decimal Places: Automatic
- Sort By: CSAT Score descending
- Then Sort By: Resolved on First Contact descending
- Title: CSAT Score
- Legend Position: Right
6.) Add a Component with the following settings
- Select the report Cases Closed Last 90 Days
- Display As: Stacked Veritcal Bar Chart
- X-Axis: Case Owner
- Y-Axis: Record Count
- Stack By: ScreenMeet
- Display Units: Shortened Number
- Y-Axis Range: Automatic
- Decimal Places: Automatic
- Sort By: Case Owner ascending
- Then Sort By: ScreenMeet descending
- Title: Case Closed by Agent
- Legend Position: Right
.png)
