Dashboards and Reports
- 02 Oct 2023
- 1 読む分
- 印刷する
- 闇光
- PDF
Dashboards and Reports
- 更新日 02 Oct 2023
- 1 読む分
- 印刷する
- 闇光
- PDF
The content is currently unavailable in Ja - 日本語. You are viewing the default English version.
記事の要約
この要約は役に立ちましたか?
ご意見ありがとうございます
Introduction:
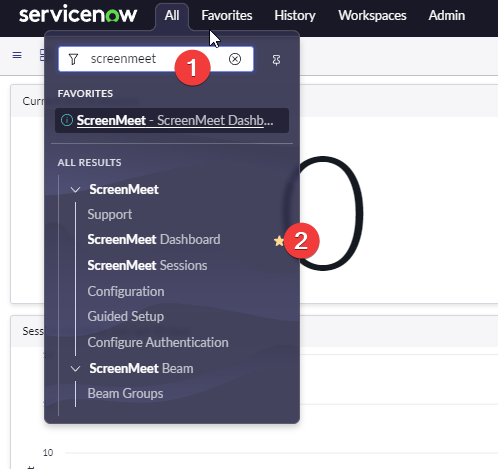
ScreenMeet offers two main features for reporting on sessions within ServiceNow: the Dashboard and Custom Reports.
Dashboard
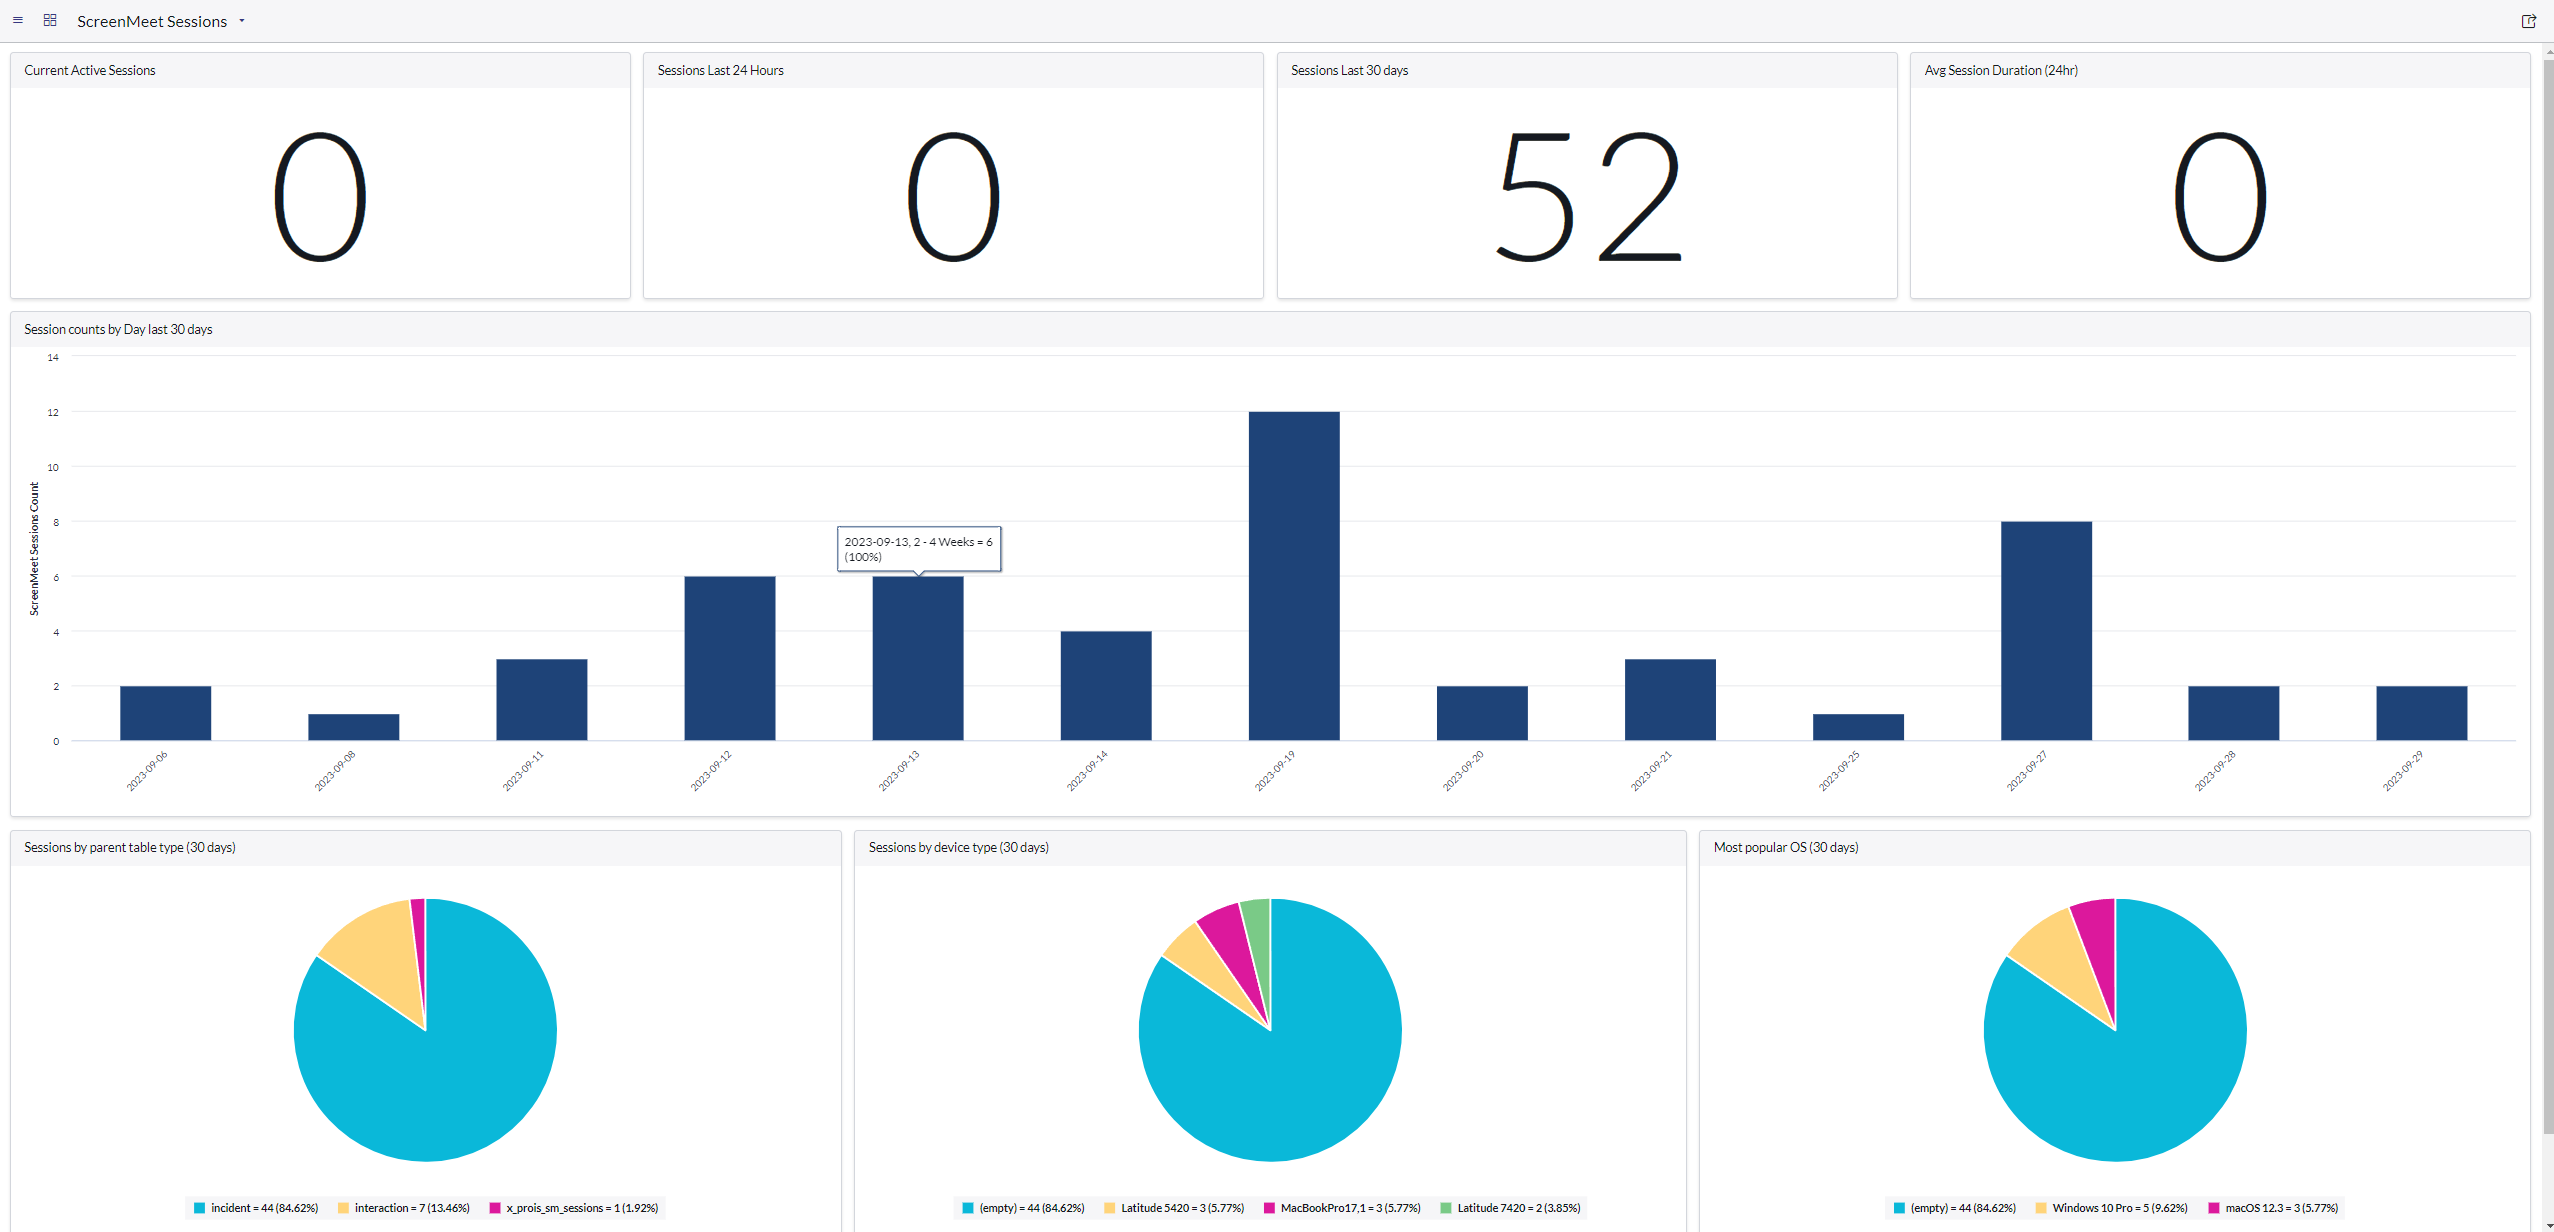
Here are the fundamental aspects of this feature:
- Current Active Sessions
- Sessions Last 24 hours
- Sessions Last 30 Days
- Avg session duration in the last 24 hours
- Session counts by day, last 30 days
- Sessions by parent table type
- Sessions by device type
- Most popular OS


Creating a Custom Report
ScreenMeet offers the flexibility for your administrators to create custom reports tailored to your precise requirements. Here's how you can accomplish this:
- Navigate to ServiceNow as a ServiceNow administrator
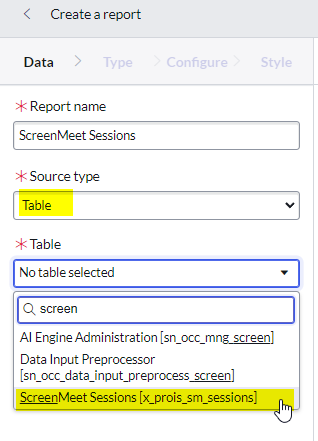
- Search for "Reports" and select "Create New Report"
- Name the report with your desired name
- For the "source type", select "Table"
- Select ScreenMeet Sessions (x_prois_sm_sessions)

- Click Next
- All sessions will be shown. This is a great starting point for building the base report. Subsequent reports can be made based on your requirements and added to your own dashboards.
- You may add any visualization type, such as a bar graph, time series, etc.
- You may add filter conditions, such as creating a specific report for a certain team, for certain sessions based on session metadata (show all sessions greater than 30 days, etc)
Conclusion
This concludes the overview of the ScreenMeet Dashboard and the process of creating Custom Reports. With these features at your disposal, you can efficiently manage sessions and gain valuable insights into your usage. For further assistance or inquiries, please consult our support resources or contact our dedicated support team.
この記事は役に立ちましたか?
.png)
