A worked network example
- Select Agent.
- Send: “Run a general-purpose network test using read-only diagnostics. Do not change any network or device settings.”
- Inspect the plan. Under the default policy, read-only diagnostics execute automatically and show progress.
- Wait for the results and the final explanation.
- Select the result's document icon (1) to open View execution details when you need to verify a measurement or the exact output.
In the captured session, Harness selected connectivity/DNS and active-interface diagnostics. The tests completed and the agent reported a healthy connection at that moment while leaving the intermittent fault unconfirmed. Your plan may differ with the device, earlier evidence, and enabled tools.
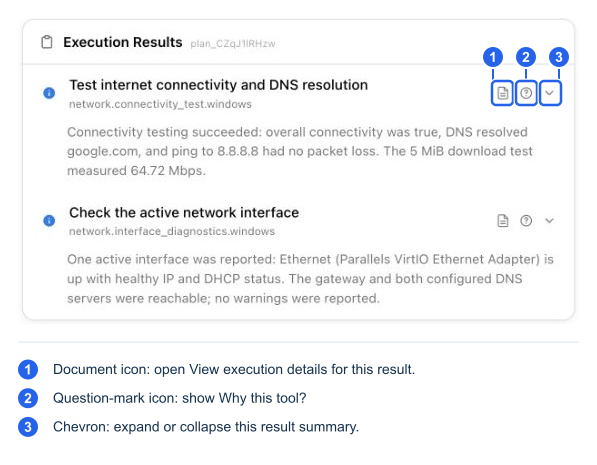
Execution Results summarize the returned evidence. On each result, 1 opens execution details, 2 shows Why this tool?, and 3 expands or collapses the summary. The final answer explains what the evidence establishes and what remains uncertain.
Inspect what actually ran
Select the document-shaped View execution details icon (1) in the result figure above. The inspector can show status, duration, exit code, tool identity, parameters when present, source, output, and errors. Before execution, some result fields are naturally unavailable.
In the inspector below, 1 is the chevron that expands Source Code. 2 and 3 are the Chat about this speech-bubble icons beside Source Code and Output, respectively. The adjacent overlapping-squares icons copy the selected content.
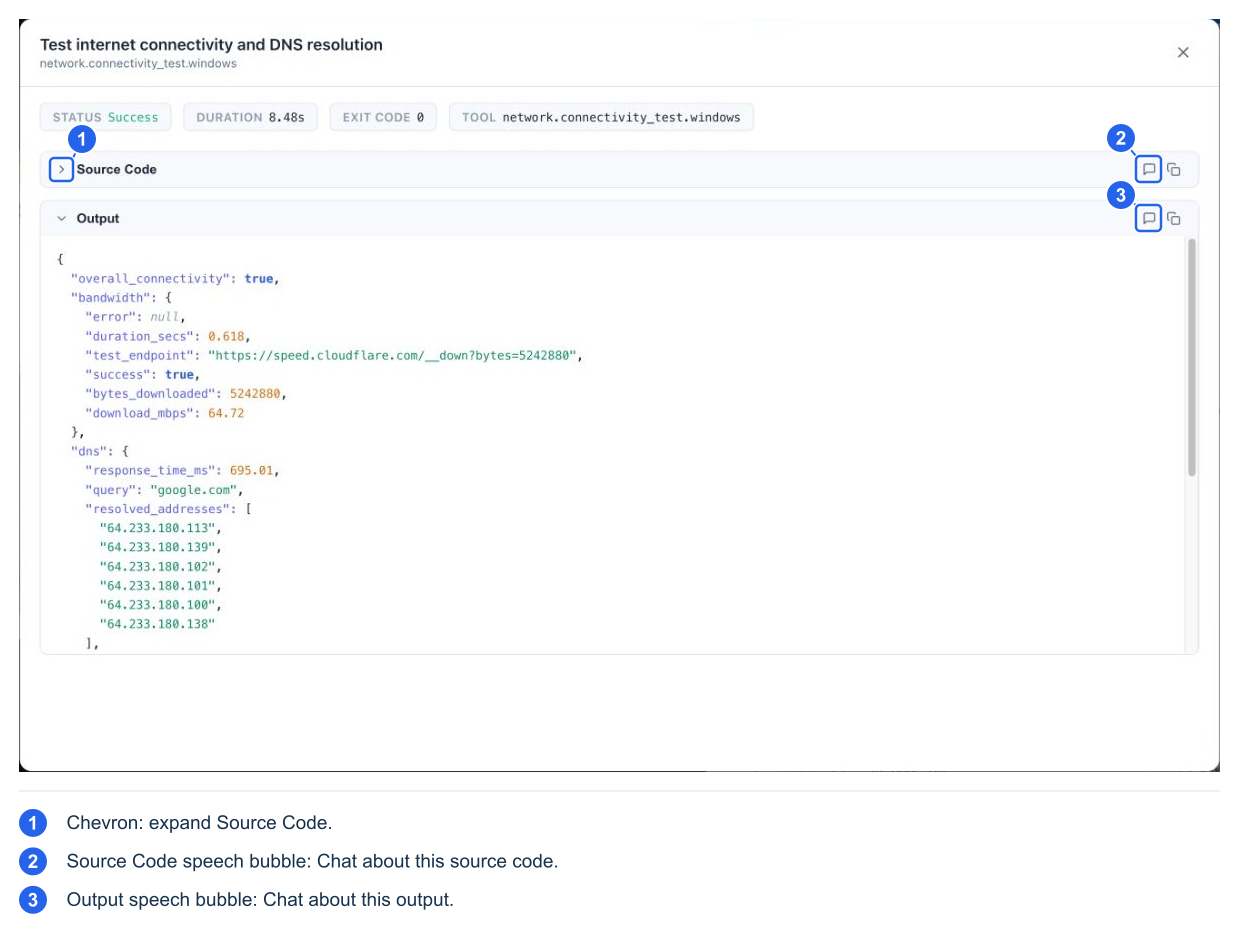
Read the output as well as the status. A successful process can report an unavailable subsystem, no matching records, or a finding that still needs interpretation. An error, timeout, or partial result must not be read as “no problem found.”
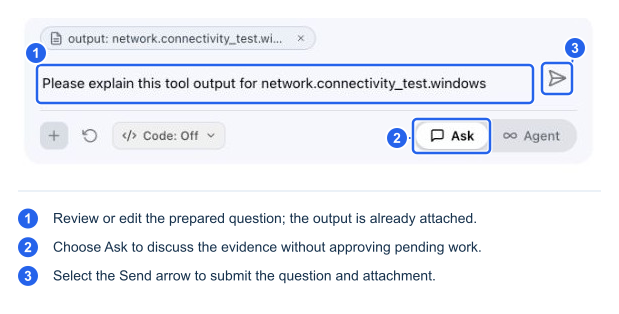
To ask about a result, select the Output speech bubble (3) in the inspector. To ask about the script itself, select the Source Code speech bubble (2). Chat about this attaches that selected content to the composer and prepares a question.
In the composer figure below:
- Review or edit the prepared question at 1; the tool output is already attached.
- Choose Ask (2) to discuss the evidence while keeping any pending plan parked.
- Select the Send arrow (3) to submit the question and attachment.
Other diagnostic examples
| Request | Expected investigation | What to watch for |
|---|---|---|
| “This laptop keeps dying. Check battery health.” | A battery report and relevant power/shutdown evidence, depending on the available tools and procedure | A VM or desktop may have no battery. That is a valid result, not proof of a battery fault |
| “The PC blue-screened twice yesterday.” | Discover dumps and debugger availability; analyze available dumps; correlate supporting evidence | Missing dumps or debugger support limits the answer. A debugger installation/removal is a separate change that may require admin and approval |
| “Printing is stuck.” | Check the selected printer, queue, service, and connectivity before remediation | Clearing jobs can discard queued work; restarting a service can interrupt printing |
For a multi-step skill such as BSOD analysis, follow-up choices can affect how much evidence is collected or whether a temporary tool is removed. Labels and the exact steps depend on the evidence and enabled capabilities; do not expect every session to follow an identical script.